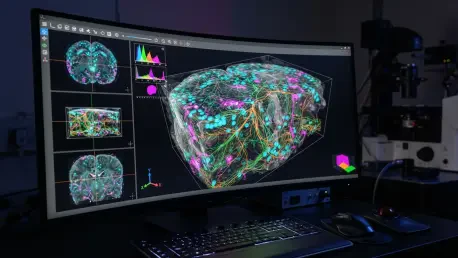

Specialized somata counting features utilize morphological filtering and watershed segmentation to separate overlapping nuclei in dense tissue samples. This advancement represents a critical shift in how researchers approach the quantification of cellular structures within voluminous and complex three-dimensional datasets. While the last decade has seen a rapid expansion in confocal and multi-photon microscopy hardware, the software required to interpret the resulting high-resolution image stacks has often remained tethered to outdated two-dimensional methodologies. This technological lag creates a significant bottleneck, where researchers can acquire breathtaking 3D images but are forced to rely on manual counting or simplified 2D interpretations that fail to capture the true spatial complexity of biological systems. Bioloc3D addresses this disparity by offering a fully open-source, automated pipeline designed to bridge the gap between raw image acquisition and meaningful statistical results, ensuring that the depth of analysis finally matches the depth of the imaging itself.
The development of this toolset by a multidisciplinary research team signifies a move toward more rigorous, repeatable science in the study of protein interactions and cellular connectivity. By automating the identification and colocalization of fluorescent signals, Bioloc3D removes the subjective errors and fatigue-driven inconsistencies inherent in manual data handling. The system is designed to handle the entire analytical journey, transforming thousands of individual optical sections into a cohesive narrative of biological interaction. This transition from qualitative observation to quantitative precision allows scientists to explore the nuances of tissue architecture with a level of detail that was previously inaccessible to those without extensive computational backgrounds. As microscopy continues to evolve throughout 2026 and into the coming years, tools like Bioloc3D ensure that the quantitative output of a study is as robust as the visual evidence provided by high-end imaging hardware.
Architectural Precision: The Dual-Module Framework
Bioloc3D is meticulously structured into a two-tiered system that separates the computationally intensive tasks of image processing from the nuanced requirements of data visualization and statistical analysis. The primary module, known as B3D-Img, operates as a specialized toolset within the ImageJ (Fiji) environment, which remains the industry standard for biological image manipulation. This component is responsible for the heavy lifting of spatial analysis, where it individualizes fluorescent objects from separate channels and identifies their overlaps in three-dimensional space. Unlike traditional pixel-counting methods that only measure signal intensity, B3D-Img treats fluorescent signals as discrete physical entities. By leveraging the 3D Object Counter plugin, it defines objects by their actual volumes and positions, providing a much more accurate representation of how proteins, organelles, or cell types are distributed within a specific volume of tissue.
The second module, B3D-Plt, functions as a standalone application developed in Python and distributed as an executable for both Windows and macOS platforms. This division of labor is a strategic choice that brings the power of advanced Python-based analytical libraries to researchers who may not have experience with coding. B3D-Plt ingests the raw data spreadsheets generated by the imaging module and automatically performs complex calculations, data summarization, and high-quality plotting. This automated backend ensures that the transition from a processed image to a publication-ready graph is seamless and free from the errors that often occur during manual data entry or manipulation in generic spreadsheet software. By providing a dedicated plotting engine, the developers have ensured that the analytical rigor of the software is maintained through every stage of the research workflow, allowing for a standardized approach to data interpretation.
Computational Logic: Mastering 3D Spatial Arithmetic
The core processing pipeline within the B3D-Img module follows a rigorous sequence designed to maximize the signal-to-noise ratio before any quantification occurs. The process begins with the critical step of channel splitting and the application of user-defined thresholds, which serve to distinguish meaningful biological signals from background interference and electronic noise. Once the images are thresholded, the software converts the raw voxels into a series of individualized object maps. In these maps, every distinct fluorescent structure is assigned a unique intensity tag, allowing the system to track thousands of individual elements simultaneously across hundreds of optical sections. This individualization is essential for accurate colocalization analysis, as it allows the software to distinguish between two objects that are merely near each other and two objects that truly occupy the same spatial coordinates in three dimensions.
To determine the degree of interaction between different fluorescent markers, Bioloc3D utilizes 3D image arithmetic, specifically an “AND” operation between the object maps of different channels. This logic isolates only those voxels that are present in both signals, creating a new map that represents the “interaction volume.” Because each original object carries a unique tag, the software can correlate these interaction volumes back to the specific parent structures. This level of granularity allows researchers to quantify the exact percentage of an object’s volume that is in contact with another signal, providing a much deeper understanding of biological proximity than simple co-occurrence. This method is particularly effective for mapping complex microcircuits or organelle interactions where the precise scale of contact is as important as the contact itself, providing a mathematical foundation for inferring functional relationships between cellular components.
Functional Insights: Beyond Basic Colocalization
The specialized somata counting features mentioned previously are just one part of a broader suite of tools designed to provide functional context to spatial data. In many biological experiments, it is not enough to simply know that two proteins overlap; researchers often need to normalize this data against a baseline, such as the total number of cells in a sample. By using ubiquitous nuclear stains like DAPI, Bioloc3D can automatically count cell bodies and measure their volumes, providing a reliable reference for cellular density. The software applies morphological filtering to clean up the signal and uses watershed segmentation to ensure that nuclei in dense clusters are recognized as individual units rather than single, large masses. This automated census of the cellular environment allows for more sophisticated comparisons between different tissue regions or experimental conditions, ensuring that results are always contextualized within the biological landscape.
Furthermore, the toolset is capable of incorporating a third fluorescent channel to serve as a verification marker, which is a vital feature for high-precision neurobiology and cell signaling studies. For example, when investigating the spatial overlap between two different types of neurons, a researcher can use a third channel to mark synaptic proteins. Bioloc3D then analyzes whether the spatial proximity of the two primary signals coincides with these synaptic markers. This functionality transforms a purely spatial observation into a functional one, allowing scientists to differentiate between a random overlap and a genuine synaptic contact. By using this hierarchical approach to data verification, the software helps researchers avoid the pitfalls of over-interpreting spatial co-occurrence, leading to more accurate models of how cells communicate and interact within complex tissues such as the brain or gut.
Operational Excellence: Efficiency and Statistical Rigor
The implementation of Bioloc3D has demonstrated a profound impact on the efficiency of laboratory workflows, specifically by reducing the time required for complex 3D analysis by nearly twentyfold compared to manual methods. This speed does not come at the expense of accuracy; in fact, the automated nature of the tool eliminates the inevitable variability that occurs between different human observers. During validation tests, the software proved to be remarkably robust, maintaining its reliability even when processing images with low signal-to-background ratios or other common artifacts found in real-world microscopy. However, the developers emphasized that the quality of the output remains dependent on the resolution of the input. To achieve the best results, it is recommended that researchers use high-quality objectives and optimize their acquisition settings to ensure that the voxel size is appropriate for the structures being measured, thereby minimizing the risk of false positives.
In its final analytical stage, the software utilized a modern statistical framework known as estimation statistics, which moved away from a total reliance on traditional p-values. By integrating the dabest Python package, the plotting module generated swarm plots that displayed the full distribution of data points alongside bootstrap 95% confidence intervals to illustrate effect sizes. This approach provided a more transparent and nuanced view of the experimental results, allowing researchers to see the magnitude of differences between groups rather than relying on a binary assessment of significance. This move toward greater statistical depth represented a significant improvement in how biological data is communicated and interpreted. Ultimately, the success of Bioloc3D was rooted in its commitment to open science, as the team provided the entire toolset and detailed protocols via public repositories, encouraging the global scientific community to adapt and refine these methods for future discoveries.