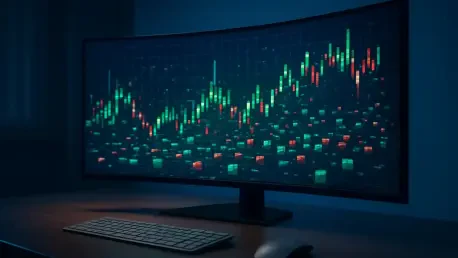

Real-time news updates and company descriptions are integrated directly into the visual interface to provide an immediate narrative for price movement. This structural evolution marks a significant departure from conventional data tables, allowing market participants to synthesize vast quantities of information without the cognitive load typically associated with high-frequency financial monitoring. By employing advanced algorithmic sorting, the platform now prioritizes assets based on a combination of technical momentum and fundamental shifts, ensuring that the most relevant market movers are instantly identifiable. This system was designed to address the growing complexity of global markets, where traditional static charts often failed to capture the interconnectedness of various asset classes. The inclusion of interactive layers enables users to drill down into specific sub-industries with a single click, effectively bridging the gap between macro-level trends and micro-level stock performance. As the financial landscape continues to grow more competitive, tools like this provide the necessary edge for those who require both speed and depth in their daily research routines. The interface transforms abstract numbers into a dynamic ecosystem of information that reflects the true pulse of the global economy.
The Evolution of Market Data Interpretation
The financial sector has witnessed a dramatic transition from 2026 to 2028 as analysts increasingly move away from monochromatic list views toward immersive, multi-layered data ecosystems. The current environment demands more than just price alerts; it requires a spatial understanding of where capital is flowing across various market capitalizations and geographic regions. This transition reflects a broader trend in financial technology where the objective is to minimize the time between data ingestion and actionable decision-making. By visualizing hundreds of tickers simultaneously through a color-coded and size-weighted matrix, the interface highlights outliers that would remain hidden in a standard spreadsheet. Traders can now observe the ripple effects of a central bank announcement or a major earnings beat as it propagates through related sectors in real time. This immediate feedback loop is essential for maintaining a balanced portfolio in a market that reacts within milliseconds to new information, ensuring that no significant price deviation goes unnoticed or unanalyzed by the user.
Beyond mere visualization, the system leverages a sophisticated weighted average algorithm that balances price performance with trading volume to distinguish between superficial spikes and genuine trend reversals. This prevents the common pitfall of following low-liquidity stocks that exhibit high volatility but lack the institutional backing required for sustained growth. The matrix further categorizes these movements into distinct heat maps that can be toggled to show performance over varying timeframes, from a single trading session to several fiscal quarters. This longitudinal perspective allows for the identification of cyclical patterns that might be obscured by short-term market noise. Moreover, the integration of sentiment analysis tools within the matrix provides a qualitative layer to the quantitative data, reflecting the current mood of the broader investing community. Such a holistic approach ensures that users are not just seeing numbers, but are understanding the underlying psychology and liquidity constraints that drive market behavior, leading to more informed and resilient investment strategies.
Strategic Implementation for Modern Portfolios
Technological constraints that once hindered the rendering of thousands of live data points have been superseded by localized browser-side processing and edge computing breakthroughs. The Matrix utilizes these advancements to provide a fluid user experience where zooming and panning across the entire S&P 500 or Nasdaq 100 occurs with zero latency. This responsiveness is critical during periods of high market stress when every second counts toward executing an exit or entry strategy. Each node within the visualization serves as a gateway to deeper analytics, including historical volatility curves and institutional ownership percentages. The backend infrastructure supports simultaneous connections to multiple global exchanges, synchronizing disparate data streams into a singular, cohesive view of the global economy. By offloading the heavy computational tasks to optimized graphics pipelines, the interface remains light and accessible even on mobile devices or lower-specification workstations. This democratization of high-end analytical tools ensures that individual traders have access to the same caliber of market intelligence as larger hedge funds.
The release of this advanced visualization platform addressed the long-standing challenge of information density in modern finance by converting abstract numbers into intuitive visual structures. It eliminated the fragmentation of data across multiple tabs and windows, streamlining the research process into a single, cohesive interface. Traders who adopted this technology found that their ability to spot emerging trends improved significantly, as they were no longer buried under a mountain of disconnected spreadsheets. The transition toward this interactive model allowed for a more nuanced understanding of market volatility and its impact on diverse asset classes. Moving forward, the logical next step for users involved the integration of personalized API feeds to further refine the data inputs according to specific niche requirements. The successful deployment of this tool demonstrated that the future of market analysis resided not in more data, but in better ways to visualize and interpret the data already available. Analysts were encouraged to continue refining their visual filters to stay ahead of an increasingly automated and fast-paced global financial environment.