
I'm thrilled to sit down with Chloe Maraina, a renowned Business Intelligence expert with a deep passion for crafting compelling visual stories through big data analytics. With her sharp expertise in data science and a forward-thinking vision for data management, Chloe has become a leading voice in

In the ever-evolving landscape of the Lloyd’s insurance market, a seismic shift is underway as innovative approaches to performance assessment challenge long-standing norms, promising to redefine how success is measured in this intricate and cyclical industry. For years, stakeholders have grappled

I'm thrilled to sit down with Chloe Maraina, a Business Intelligence expert whose passion for big data and visual storytelling has positioned her as a visionary in data management and integration. With a sharp eye for innovation, Chloe has been instrumental in driving transformative projects that

In an era where global trade demands ever-increasing efficiency and environmental responsibility, the Port of Everett in Washington state has emerged as a trailblazer with a groundbreaking initiative that could redefine port operations worldwide. Known as the Data Analytics for Port Equipment
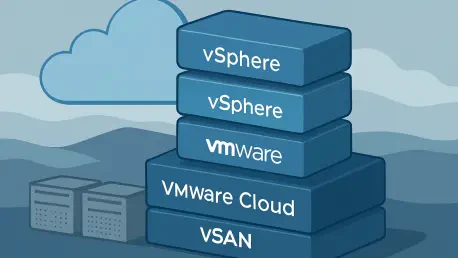
In an era where digital transformation dictates the pace of business success, the unveiling of VMware Cloud Foundation (VCF) 9.0 at VMware Explore 2025 stands as a landmark moment for data center evolution, marking a significant shift in IT infrastructure. This release is not merely an incremental
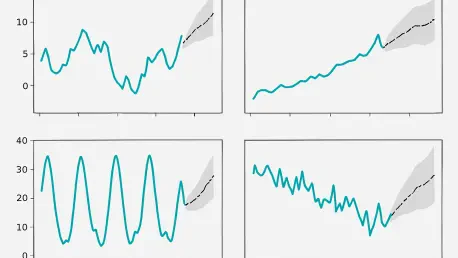
In the rapidly evolving field of time series forecasting, crafting efficient and adaptable workflows is essential for tackling complex datasets and achieving accurate predictions. GluonTS, a powerful open-source library for time series modeling, offers a robust framework to streamline this process