A single line of faulty code deployed within a sprawling digital ecosystem can silently erase millions in revenue long before the first critical alert ever flashes on a screen. This quiet bleed of resources, unseen by traditional IT dashboards, exposes a dangerous gap between technical performance and business health. In today’s hyper-connected economy, where digital services are the primary interface for customer interaction and revenue generation, organizations can no longer afford to operate with this blind spot. The challenge has given rise to a new discipline that extends far beyond legacy monitoring, one that seeks to provide not just data, but deep, contextual understanding of system behavior and its direct impact on the bottom line. This is the maturation of observability, a journey that transforms it from an engineering tool for firefighting into a strategic asset for business resilience and autonomous operations.
Beyond the Red Alert When a System Glitch Becomes a Revenue Crisis
The disconnect between traditional IT alerts and their real-world financial consequences has become a critical vulnerability for modern enterprises. A legacy monitoring system might report a spike in CPU utilization or an increase in database query latency, but these technical signals exist in a vacuum. They fail to answer the questions that truly matter to the business: Is this slowdown preventing customers from completing purchases? Which specific user segment is experiencing the worst of this degradation? What is the projected revenue loss if this issue persists for another hour? This ambiguity forces a reactive, often panicked, response where every alert is treated with the same level of urgency, leading to team burnout and a constant state of firefighting.
This environment raises a pivotal question: what if operational data could do more than just report on past failures? What if the vast streams of telemetry flowing from applications, infrastructure, and user interactions could be harnessed to predict business impact before it fully materializes? The goal of mature observability is to answer this question affirmatively. It seeks to build a direct, quantifiable link between the health of the technology stack and the health of the business. By contextualizing technical events with business metrics, an organization can begin to distinguish between a minor system anomaly and an impending revenue crisis, enabling it to prioritize resources, manage risk proactively, and protect its most critical financial outcomes.
Why Yesterdays Monitoring Cant Manage Todays Complexity
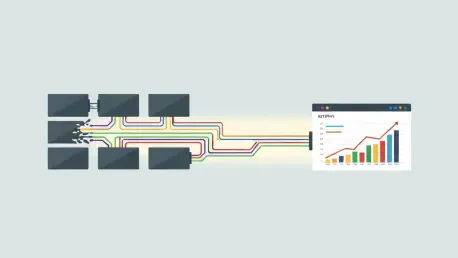
The foundational reason legacy monitoring fails is that it was designed for a fundamentally different era of technology. It was built to oversee predictable, monolithic systems where cause and effect were relatively straightforward. Today’s digital landscape, however, is characterized by sprawling, distributed microservice architectures. A single user request, such as adding an item to a shopping cart, can trigger a cascade of interactions across dozens or even hundreds of independent services. This architectural shift has created an explosion of complexity and, with it, a deluge of telemetry data—logs, metrics, and traces—that has completely overwhelmed the human capacity for manual analysis.
The sheer volume and velocity of this data render traditional dashboards and predefined alerts inadequate. No single engineer or team can possibly hold the complete mental model of such a dynamic system. Consequently, a strategic imperative has emerged to elevate observability from a niche, engineering-level concern to a C-suite priority. This elevation occurs when organizations stop viewing system performance in isolation and start measuring it through the lens of business outcomes. By directly linking uptime, latency, and error rates to key performance indicators like revenue, customer acquisition cost, and lifetime value, observability becomes the connective tissue between the technology that runs the business and the metrics that define its success.
The Five Stage Evolution from Reactive Fixes to Autonomous Operations
The journey from basic alerts to intelligent, self-healing systems unfolds across a clear five-stage maturity model. The first stage, Monitoring, represents a reactive view of what has already broken. It is characterized by predefined thresholds and alerts designed for simpler, on-premise applications. Its primary function is to notify teams after a failure has already occurred, offering little context on the root cause or its business impact in complex, modern systems. This stage answers the question “is the server up?” but struggles to provide any deeper insight, leaving engineers to manually piece together clues after the damage is done.
The second stage, Technical Observability, marks a significant leap forward by creating a rich, correlated view of telemetry. By integrating logs, metrics, and traces, it successfully answers the question “what happened?” and enables much faster diagnosis of incidents. However, this advancement introduces a new challenge: signal-to-noise overload. As Jeremy White, VP of Engineering at SpotOn, discovered after implementing a modern platform, teams can quickly go from having insufficient data to being drowned in it. This stage places an immense cognitive burden on engineers, who must sift through mountains of data to find the critical signals, highlighting the need for a more intelligent and context-aware approach.
The third and pivotal stage is Business Observability, where technical signals finally meet financial consequences. Here, the focus shifts from technical metrics to answering business-centric questions: What is the revenue impact of this outage? Which specific customers are affected? How should remediation efforts be prioritized to minimize financial loss? This stage connects technical Service-Level Indicators (SLIs) like latency to business-facing Service-Level Agreements (SLAs). Michael Woodside, Director of Global DevOps at Pacvue, exemplifies this by directly correlating faster incident resolution with reduced customer churn. Similarly, Khushboo Nigam, a Principal Cloud Architect at Oracle, describes the formal hierarchy that links raw metrics (SLIs) to internal targets (SLOs) and finally to contractual customer obligations (SLAs), making business risk quantifiable and manageable.
The fourth stage, AI-Assisted Observability, introduces artificial intelligence as a powerful force multiplier. AI excels at interpreting petabyte-scale data to identify subtle patterns and predict cascading failures that are invisible to human operators. Forrester analyst Carlos Casanova compares this to a “storm forecaster” that stitches together disparate signals across the entire stack to predict large-scale incidents. AI copilots further accelerate root cause analysis by summarizing complex causal chains and offering data-driven hypotheses. This stage also establishes a crucial two-way relationship: observability becomes essential for governing AI models themselves, monitoring them for drift, degradation, and hallucinations to ensure they remain trustworthy and reliable.
The final stage is Autonomous Operations, where the system moves beyond diagnosis to autonomously resolving incidents. This is the culmination of the maturity journey, where insight is translated directly into action. AI agents, governed by risk-based models and human-in-the-loop oversight for critical systems, can perform investigations and execute remediation steps. At Pacvue, this is already in practice, with different agents handling investigation and remediation based on predefined risk levels. This transformation frees human operators from routine firefighting, as noted by SpotOn’s Jeremy White, who has seen it collapse traditional escalation chains and reduce “bus-factor” risk by democratizing system knowledge across the engineering team.
Expert Perspectives on the Maturing Discipline
The progression through these stages is not merely theoretical; it is being actively navigated by technology leaders across the industry. Their collective insights paint a clear picture of the challenges and rewards. Forrester’s Carlos Casanova emphasizes the big-picture view, where AI acts as a unifying intelligence layer, providing a holistic forecast of system health that transcends the siloed perspectives of individual teams. It sees the interconnected patterns that precede major incidents, shifting the paradigm from reaction to preemption. This broad visibility is what allows an organization to manage systemic risk rather than just isolated component failures.
The tangible, bottom-line impact of this maturity is underscored by Pacvue’s Michael Woodside. His work demonstrates a direct, measurable link between improved operational metrics, like Mean Time To Resolve (MTTR), and critical business outcomes, such as customer churn. He also highlights the critical human element in adopting advanced tools, noting that AI explainability—the ability for a model to show its work with “breadcrumbs”—is essential for building the trust needed for engineers to rely on its recommendations. This trust is the foundation upon which more advanced automation can be built, freeing up valuable engineering time for innovation instead of manual log analysis.
This human element is further explored by SpotOn’s Jeremy White, who speaks to the real-world challenge of data overload and how mature observability transforms team functions. It enables customer support to move from a reactive posture, where they only hear about problems from frustrated customers, to a proactive one where they can identify and address issues before the customer is even aware. This shift fundamentally alters the customer relationship for the better. At the same time, it collapses traditional engineering escalation chains, empowering a wider range of engineers to solve complex problems by providing them with the necessary context and insights, which were previously held by a small group of senior experts.
Providing the structural framework for this entire journey is the hierarchy detailed by Oracle’s Khushboo Nigam. She clarifies the methodical process of connecting raw technical metrics (SLIs) to internal performance targets (SLOs) and ultimately to the contractual, customer-facing obligations defined in SLAs. This structured approach is what translates the abstract concept of system health into the concrete language of business risk and financial liability. It provides the disciplined foundation required to build a robust business observability practice, ensuring that every technical decision can be traced back to its potential impact on the customer and the company’s commitments.
Charting the Course Toward Autonomous Operations
Advancing along the observability maturity curve is a deliberate journey that requires a clear, strategic roadmap. The first step is to Establish Coherence across the technology stack. Many organizations suffer from fragmented tooling, with different teams using different platforms, creating data silos that prevent a holistic view of system health. Unifying these disparate sources into a single, cohesive telemetry pipeline using open standards like OpenTelemetry is foundational. This creates a complete and reliable data foundation that captures logs, metrics, traces, and even AI signals, providing the necessary context for any advanced analysis or automation.
With a unified data pipeline in place, the next imperative is to Drive Business Alignment. This involves systematically connecting technical performance metrics to tangible business outcomes. It is not enough to track latency; one must quantify how that latency impacts customer conversion rates. It is not enough to measure uptime; one must calculate the revenue lost per minute of an outage for a critical service. By quantifying the impact on revenue, customer satisfaction, and SLAs, technology leaders can make a compelling business case for investing in advanced capabilities like AI and automation, framing them not as costs but as essential investments in business resilience.
As artificial intelligence becomes more deeply integrated into both observability and core business functions, organizations must Implement AI Governance. This means extending observability practices to the AI layer itself. AI models are not static; they can drift over time, their performance can degrade, and they can produce unreliable or even harmful outputs. Actively monitoring for model drift, instability, and other signs of degradation is crucial to ensure that AI systems remain reliable, auditable, and trustworthy. This is not just a technical requirement but a core component of risk management in an AI-driven enterprise.
Finally, organizations must Build Guardrails for Automation to approach the final stage of autonomous operations safely and progressively. This is not an overnight switch but a gradual journey. The process should start by automating low-risk investigative steps, allowing AI to gather context and suggest solutions. From there, teams can move to automated remediation for non-critical systems, gradually expanding the scope of automation as confidence, traceability, and robust human-in-the-loop oversight are established. This careful, phased approach allows an organization to reap the benefits of automation while managing the associated risks, building a resilient and self-healing digital infrastructure.
The path from basic monitoring to autonomous operations represented a fundamental redefinition of operational responsibility. The journey was no longer about simply fixing what broke, but about building systems that could anticipate, adapt, and protect business value in real time. Organizations that successfully navigated this evolution discovered they had not just improved their IT departments; they had fundamentally re-engineered their capacity for resilience, innovation, and sustained growth in an increasingly complex digital world. This transformation shifted human capital away from repetitive, reactive tasks and toward strategic initiatives, ultimately creating a more robust and intelligent enterprise. The maturity of observability became a direct reflection of the maturity of the business itself.


