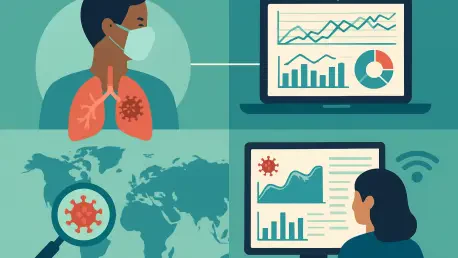

A “one-size-fits-all” approach to digital dashboard design often fails to account for the varying technical literacy of different user groups in the health sector. The rapid transformation of respiratory pathogen surveillance dashboards has become one of the most visible developments in public health since the pandemic era. Initially conceived as emergency response tools to communicate real-time infection rates, these digital platforms have evolved into permanent fixtures within the global health infrastructure. This transition represents a significant shift in how data is processed and shared, yet it brings a unique set of growing pains as systems move from temporary fixes to long-term assets. A landmark workshop held in Lyon, France, brought together creators, developers, and users to evaluate the current state of these digital tools. Organized by the Center of Excellence for Respiratory Pathogens (CERP) and the Netherlands Institute for Health Services Research (Nivel), the event focused on bridging the gap between technical visualization and practical public health action. The core challenge lies in ensuring that these dashboards remain timely, actionable, and sustainable in an era where the demand for data transparency is higher than ever before. This requires a systemic rethink of how information is presented to diverse audiences, moving beyond simple charts toward comprehensive narratives that can guide real-world health interventions.
Strategic Design: Bridging Creator and User Needs
The subjective nature of success in digital public health tools often dictates the trajectory of their development and ultimate utility. For a clinical researcher, the value of a dashboard lies in high-granularity data, including age-stratified infection rates, viral load metrics, and complex epidemiological indicators that allow for deep-dive analysis. Conversely, the general public and high-level policymakers typically look for simplified visualizations that convey immediate risk levels without requiring an advanced degree in biostatistics. The recent deliberations in Lyon highlighted that when these needs are not reconciled, the dashboard becomes a source of confusion rather than clarity. If a platform is too complex, it risks being ignored by those who make funding decisions; if it is too simple, it loses the trust of the scientific community. Finding the “sweet spot” involves creating multilayered interfaces where different users can toggle between summary views and detailed data subsets. This ensures that information is accessible to a local school administrator deciding on masking policies while remaining robust enough for a genomic surveillance team tracking new variants across different jurisdictions.
The adoption of human-centered design principles has emerged as a corrective measure for the developer-centric models of the past. Instead of building a tool and then searching for an audience, contemporary organizations are involving end users in the initial design phases to identify specific pain points and information requirements. This iterative process allows developers to understand how different stakeholders interact with data visualizations in real-time environments. For example, a healthcare worker in a busy clinic might need a dashboard that works seamlessly on a mobile device and provides localized alerts, whereas a national analyst might require a desktop-optimized interface with extensive export capabilities for secondary reporting. By focusing on these functional requirements, public health agencies can move away from aesthetic vanity metrics and toward tools that facilitate genuine public health action. This collaborative approach fosters a sense of ownership among users, which is essential for maintaining the long-term relevance and accuracy of the surveillance system as a whole. Engaging stakeholders early and often ensures that the final product serves as a functional extension of their daily operational needs.
Data Synergy: Integrating Diverse Information Streams
Traditional respiratory surveillance has long been the bedrock of public health, relying on a network of sentinel sites and laboratory-confirmed detections to track the spread of pathogens. This gold standard provides high specificity, allowing officials to know exactly which strains are circulating and in which populations. However, the inherent latency of clinical reporting—often spanning one to two weeks from the onset of symptoms to the final data upload—frequently means that officials are looking in the rearview mirror. By the time a spike is confirmed via laboratory tests, the window for proactive mitigation may have already closed. To bridge this gap, modern dashboards are now integrating traditional surveillance with non-traditional, faster-moving data streams. This hybrid approach aims to provide a more holistic view of the viral landscape, balancing the deep accuracy of the laboratory with the immediate signals found in secondary indicators. The challenge lies in calibrating these different speeds so they tell a consistent story rather than presenting conflicting versions of reality to a skeptical public.
Innovations such as wastewater surveillance and the qualitative analysis of digital news media have shifted the timeline of pathogen detection significantly. Wastewater monitoring, in particular, has proven to be a reliable early warning system, often identifying the presence of a virus in a community several days before individuals seek medical attention or clinical tests are processed. Similarly, tracking pharmaceutical sales for over-the-counter flu medications or monitoring increases in specific health-related search terms can provide a pulse on the health of a population in near real-time. Despite these advantages, surveillance experts caution that these faster data streams are often noisier and less specific than traditional clinical records. A dashboard that over-emphasizes wastewater spikes without contextualizing them within clinical admission rates might trigger unnecessary public alarm. Therefore, the goal of a modern surveillance interface is to present these early signals as a preliminary indicator rather than a definitive diagnosis. Clear caveats and context variables are essential to ensure that the pursuit of speed does not undermine the credibility of the entire surveillance network or lead to misinformed policies.
System Stability: Addressing Infrastructure and Sustainability
The sleek, interactive interfaces of modern public health dashboards often mask a surprisingly fragile human infrastructure. While the public sees a sophisticated digital tool that updates with clinical precision, the reality behind the scenes frequently involves small, underfunded teams performing manual tasks. In many instances, the Achilles’ heel of national surveillance systems is the reliance on a single individual responsible for cleaning, validating, and uploading data. This creates a precarious situation where the departure or burnout of a key staff member could lead to a complete system failure. Furthermore, many of these platforms were built using emergency funding that is now reaching its expiration date. As the immediate pressure of the pandemic era recedes, there is a significant risk that these vital digital assets will be neglected or abandoned due to a lack of institutionalized support. Sustainable surveillance requires more than just code; it requires a permanent workforce of data scientists and epidemiologists who are integrated into the core fabric of national health departments rather than operating on temporary contracts.
To secure the future of respiratory surveillance, a transition from temporary crisis management to institutionalized resilience is necessary. This involves integrating information technology professionals into the public health design process from the very beginning, rather than as an afterthought. By treating dashboards as critical national infrastructure—similar to power grids or water systems—governments can justify the consistent budget lines needed for their maintenance and evolution. This shift also includes a move toward more robust automation, reducing the burden of manual data entry and cleaning that currently occupies much of the workforce’s time. When systems are built to be maintainable and scalable, they can survive shifts in political priority and fluctuations in funding. A sustainable model also emphasizes the training of existing public health staff in digital literacy, ensuring that the entire organization, from the laboratory to the policy office, understands the value and operation of the surveillance tools. This investment transforms a dashboard from a standalone website into a dynamic component of a country’s national defense strategy against infectious diseases.
Technological Evolution: Leveraging Automation and AI
Technological advancements are currently reshaping the backend of surveillance dashboards, with Application Programming Interfaces (APIs) playing a pivotal role in streamlining data flow. Traditionally, data from various clinics and laboratories was sent in fragmented formats, requiring extensive manual cleaning before it could be visualized. Today, the use of automated pipelines allows for the seamless transfer of information between different health systems, significantly reducing the time it takes for a new infection to be reflected on a public dashboard. This automation not only improves the timeliness of reporting but also minimizes the potential for human error during the data entry process. By standardizing the way data is collected and transmitted, public health agencies can create a more responsive network that functions effectively even during periods of high viral activity. The implementation of these technologies allows epidemiologists to spend less time on administrative tasks and more time on high-level analysis, ultimately leading to more informed and rapid public health interventions.
In the realm of data interpretation, Artificial Intelligence (AI) and machine learning offer transformative potential, provided they are implemented with a human-in-the-loop framework. Rather than delegating public health decisions to autonomous algorithms, AI is being used to enhance the way users interact with complex surveillance data. For example, intelligent natural language processing can allow a user to ask a dashboard specific questions, such as “How does the current RSV trend compare to the same period in previous years for children under five?” The AI can then query the database and present a tailored visualization with an accompanying summary. This approach keeps the human expert at the center of the interpretive process, ensuring that the machine findings are contextualized within the broader epidemiological landscape. Experts emphasize that while AI can identify patterns and outliers much faster than a human, it lacks the nuanced understanding of social and environmental factors that an experienced official provides. Using AI as a sophisticated assistant rather than a replacement ensures that the surveillance system remains both technologically advanced and ethically grounded in expert judgment.
Global Governance: Overcoming Data Sharing Barriers
Despite the technical progress made in data visualization, legal and political barriers remain a significant hurdle to effective global respiratory surveillance. In many regions, the tension between individual privacy protections and the collective need for public health awareness has created a complex regulatory environment. The General Data Protection Regulation (GDPR) in Europe, for instance, provides essential safeguards for personal data but is often cited by researchers as a primary cause of delays in sharing critical surveillance information across borders. These friction points can result in data silos, where valuable information is locked within a single jurisdiction or institution, preventing a comprehensive understanding of how a pathogen is moving internationally. To address this, there is a growing movement toward developing GDPR-compliant but open-by-default frameworks that allow for the rapid, anonymized sharing of health data during periods of increased risk. Balancing the rights of the individual with the security of the population is a delicate but necessary task for the current generation of surveillance systems.
Beyond legal restrictions, the power dynamics of data ownership often impede the collaborative spirit required for global health security. Institutional gatekeeping and commercial interests can lead to a situation where data holders are reluctant to share their findings without significant compensation or restrictive conditions. This creates a fragmented surveillance landscape where some organizations have access to high-quality data while others are left in the dark, leading to dangerous blind spots in the global monitoring network. To combat this, the public health community is calling for stronger governance frameworks that promote transparency and accountability in data sharing. Establishing international standards for how data should be curated, reported, and accessed can help break down these silos and ensure that vital information is available to those who need it most. By fostering a culture of cooperation and prioritizing the public good over institutional interests, the global community can build a more resilient surveillance network that is capable of identifying and responding to respiratory threats before they become full-scale international crises.
Actionable Insights: Establishing Long-Term Surveillance Resilience
The transition of respiratory virus surveillance dashboards from temporary crisis response tools to permanent public health assets represented a major milestone in modern epidemiology. In the years following the global pandemic, stakeholders recognized that the digital front end of these platforms was only as effective as the data policies and human infrastructure supporting them. The Lyon workshop of 2025 served as a critical turning point where the global community moved toward a more standardized and sustainable approach to monitoring pathogen trends. By addressing the Achilles’ heel of staffing and the bottlenecks of data sharing, health agencies successfully integrated diverse data streams—from traditional laboratory reports to innovative wastewater signals—into a cohesive early warning network. This period of development marked a shift from reactive data visualization to proactive public health action, grounded in human-centered design and robust technical automation. The lessons learned from this era emphasized that the sustainability of a surveillance system relied on institutionalized funding rather than emergency grants.
Actionable next steps identified during this transformative period focused on the implementation of open-by-default governance and the deep integration of AI-assisted analytics to support expert decision-makers. The public health community moved forward by prioritizing technical literacy for all users, ensuring that the story behind the data was as accessible as the numbers themselves. This included the widespread adoption of standardized metadata, which allowed for more accurate comparisons across different regions and testing regimes. Looking ahead, the focus shifted toward maintaining the momentum of these improvements to ensure that the global network remained prepared for the emergence of novel respiratory threats. The collaborative frameworks established during these years provided a blueprint for how technology and policy could work in tandem to protect populations. By treating digital surveillance as a dynamic, living system rather than a static website, the health sector solidified its ability to provide timely and actionable insights, effectively closing the gap between data collection and life-saving intervention.