
Imagine peering into the intricate dance of evolution, where hosts and their symbionts shape each other’s destinies over millions of years, and having a tool that unveils these complex relationships with stunning clarity. That’s the promise of VIRI (Visual Inspector of Reconciliation Instances), a groundbreaking web-based platform crafted to redefine how researchers visualize cophylogenetic reconciliations. In the realm of evolutionary biology, understanding how species like parasites and their hosts co-evolve is pivotal, yet the challenge of interpreting multiple evolutionary scenarios has often been hampered by inadequate tools. VIRI steps in as a beacon of innovation, offering a way to map these shared histories by highlighting critical events such as cospeciation, duplication, host-switching, and loss. Designed with the user in mind, this tool not only clarifies tangled data but also empowers scientists to compare diverse outcomes effortlessly. By addressing long-standing visualization hurdles, VIRI is poised to become an indispensable asset in uncovering the hidden stories of co-evolution, making it a gateway to deeper biological insights.
Unpacking the Challenges of Cophylogenetic Analysis
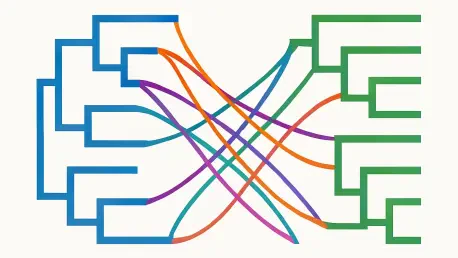
Navigating Visual Complexity in Tree Mapping
Visualizing the intertwined evolutionary paths of hosts and symbionts has always been a formidable task in cophylogenetic studies, primarily due to the sheer complexity of mapping two distinct phylogenetic trees together. These mappings aim to reveal how species have influenced each other’s development through events like simultaneous divergence or host-switching. However, the process often becomes muddled when traditional visualization methods are applied. Many existing tools struggle to present these relationships without overwhelming the viewer with cluttered graphics, especially when dealing with intricate datasets. This visual noise can obscure critical patterns, making it difficult for researchers to draw meaningful conclusions about evolutionary histories. The challenge is compounded by the fact that for any given pair of host and symbiont trees, multiple reconciliation scenarios can exist, each suggesting a different narrative of co-evolution. Without clear visuals, discerning the most biologically plausible story becomes a frustrating endeavor, often slowing down scientific discovery in a field where precision is paramount.
Another layer of difficulty arises from the inherent design flaws in conventional visualization approaches, which fail to adapt to the scale and diversity of data encountered in modern research. Tools employing node-link diagrams, for instance, frequently result in a web of overlapping lines when multiple symbiont nodes are linked to a single host, creating ambiguity. Similarly, methods that use background shapes to embed one tree within another, while somewhat clearer, still falter under the weight of frequent host-switches or large datasets. These shortcomings highlight a pressing need for a solution that can handle complexity without sacrificing readability. As evolutionary biology continues to grapple with ever-growing datasets, the demand for advanced tools that can simplify interpretation while preserving detail has never been more urgent. The limitations of past approaches set the stage for innovative platforms that prioritize clarity and usability in equal measure.
Constraints of Traditional Visualization Tools
A significant barrier in cophylogenetic research stems from the rigid integration of many existing visualization tools with specific reconciliation algorithms, severely limiting their applicability across varied research workflows. This lack of flexibility means that researchers are often confined to using outputs from particular software, restricting their ability to explore diverse datasets or alternative computational methods. Such constraints can stifle innovation, as scientists are unable to leverage the full spectrum of available reconciliation data. This rigidity not only hampers individual projects but also slows collaborative efforts, as data compatibility issues create unnecessary friction. The inability to adapt to different sources of input underscores a critical gap in the field, where the diversity of research questions demands a more versatile approach to visualization.
Beyond compatibility issues, the persistent problem of visual clutter in traditional tools continues to plague effective analysis, particularly when comparing multiple reconciliation outcomes. Excessive edge crossings and inconsistent layouts across different scenarios make it challenging to pinpoint key differences, often leaving researchers lost in a maze of unclear graphics. This visual disarray can obscure vital biological insights, delaying progress in understanding co-evolutionary dynamics. Moreover, many tools lack the capacity to handle large-scale datasets efficiently, further compounding the frustration. The cumulative effect of these limitations is a bottleneck in scientific exploration, where the potential for groundbreaking discoveries is undermined by inadequate presentation. Addressing these shortcomings requires a paradigm shift toward tools that prioritize adaptability and clarity, ensuring that the intricate stories of evolution are not lost to poor design.
Exploring VIRI’s Cutting-Edge Solutions
Blending Visual Techniques for Maximum Impact
VIRI introduces a transformative approach to cophylogenetic visualization by employing a hybrid metaphor that seamlessly integrates space-filling and node-link techniques, setting a new standard for clarity in evolutionary biology research. At the core of this innovation is the use of an “icicle plot” to represent host trees, where nodes are depicted as rectangles arranged hierarchically through adjacency, efficiently utilizing two-dimensional space to convey complex relationships. Within these host rectangles, symbiont trees are rendered as traditional node-link diagrams, ensuring that the mapping between the two is visually distinct and unambiguous. This strategic combination allows researchers to instantly recognize key reconciliation events such as losses, duplications, and host-switches, with additional visual cues like dashed lines and color highlights to flag critical patterns. By avoiding the overcrowding common in older methods, this design offers a refreshing perspective on data that might otherwise appear impenetrable, paving the way for more intuitive analysis of co-evolutionary narratives.
The impact of VIRI’s hybrid visualization extends beyond mere aesthetics, as it fundamentally enhances the interpretability of complex datasets, even for those with extensive branching structures. Unlike traditional node-link diagrams that become tangled with overlapping connections or background shape tools that falter under frequent host-switches, this approach maintains a clean and organized presentation. Losses are depicted as symbiont edges crossing through host rectangles, while duplications are evident when multiple symbiont children map to a single host space. Host-switches, often a source of visual confusion in other platforms, are clearly marked, with time-inconsistent switches highlighted to alert users to potential biological implausibilities. This meticulous attention to detail ensures that researchers can quickly grasp the nuances of each reconciliation scenario without wading through visual clutter. The result is a tool that not only presents data but transforms it into actionable insights, empowering scientists to delve deeper into the mechanisms of co-evolution with confidence.
Optimizing Readability and Comparative Analysis
One of VIRI’s standout features is its commitment to minimizing visual noise through sophisticated heuristics designed to reduce edge crossings, a pervasive issue in cophylogenetic visualizations that often obscures critical relationships. Recognizing that perfect crossing minimization is a computationally intensive problem, VIRI employs a series of practical algorithms to approximate optimal layouts. These include strategies like prioritizing shorter host-switch arcs to lessen overlap likelihood and constructing auxiliary graphs to identify planar subgraphs for cleaner renderings. Such techniques significantly enhance the readability of even the most intricate reconciliations, ensuring that connections between host and symbiont nodes are presented with minimal interference. This focus on clarity allows researchers to interpret data more efficiently, reducing the cognitive load associated with untangling messy diagrams and enabling a sharper focus on biological implications.
Equally impressive is VIRI’s capability to facilitate side-by-side comparison of multiple reconciliation scenarios, a feature that addresses a long-standing pain point in the field. By maintaining a consistent host tree layout across different visualizations, the tool preserves the user’s mental map, allowing attention to remain on variations in symbiont mappings rather than being distracted by shifting structures. This consistency is invaluable when scientists need to evaluate alternative optimal solutions to determine the most plausible evolutionary story. Whether dealing with small datasets or more complex pairings, this functionality streamlines the analytical process, making it easier to spot discrepancies and patterns that might otherwise go unnoticed. The emphasis on comparative analysis reflects a deep understanding of research needs, positioning VIRI as a vital ally in navigating the multifaceted nature of co-evolutionary studies.
Fostering Flexibility and User Engagement
VIRI distinguishes itself from many predecessors by offering unparalleled flexibility, as it is not tethered to a specific reconciliation algorithm but instead accepts pre-computed data in various formats, broadening its utility across diverse research environments. This adaptability ensures that scientists can integrate the tool into existing workflows without being constrained by software-specific outputs, a significant departure from the closed ecosystems of traditional platforms. Compatibility with common formats, supplemented by conversion scripts for other data types, means that VIRI can serve as a universal visualization solution, accommodating the varied needs of the evolutionary biology community. This open approach not only enhances individual research capabilities but also supports broader collaboration by allowing seamless integration of datasets from multiple sources, fostering a more interconnected scientific landscape.
In addition to its technical versatility, VIRI is built with user engagement at its core, incorporating interactive features that elevate the experience of exploring cophylogenetic data. Hover effects reveal detailed node information, such as species names and hierarchical connections, highlighted in distinct colors for easy reference. Customizable options, accessible through intuitive menus, allow users to tailor visualizations to their preferences, adjusting parameters like edge styles, spacing, and dimensions. Furthermore, the web-based nature of the platform ensures accessibility from any location, breaking down barriers to advanced visualization tools. Data-sharing capabilities also enable researchers to collaborate effortlessly, uploading and distributing datasets within the community. These user-centric elements collectively transform VIRI into more than just a visualization tool—it becomes a dynamic space for discovery, interaction, and collective progress in understanding the intricate bonds between species.
Reflecting on VIRI’s Transformative Legacy
Looking back, VIRI carved a significant niche in evolutionary biology by addressing the critical visualization challenges that had long hindered cophylogenetic research. Its hybrid approach, blending space-filling icicle plots with node-link diagrams, brought a level of clarity to complex host-symbiont mappings that was previously unattainable, allowing key evolutionary events to stand out with precision. The emphasis on minimizing edge crossings through innovative heuristics tackled the pervasive issue of visual clutter, while the consistent host tree layouts for comparative analysis streamlined the evaluation of multiple reconciliation scenarios. These advancements collectively elevated the standard of data interpretation, enabling researchers to uncover nuanced biological insights with greater ease.
As a legacy, VIRI’s impact prompts a forward-looking perspective on how such tools can continue to evolve to meet emerging needs in the scientific community. Future efforts could focus on enhancing performance for larger datasets, perhaps through precomputed visualizations or optimized algorithms to reduce loading times. Expanding compatibility with alternative cophylogeny models and integrating more detailed data overlays, such as geographical or temporal information, could further enrich analyses. Encouraging ongoing user feedback to refine interactive features and interface design will ensure that such platforms remain aligned with practical research demands. Ultimately, the path forward lies in building on VIRI’s foundation to create even more robust, accessible solutions that empower scientists to push the boundaries of evolutionary understanding, ensuring that the stories of co-evolution are told with ever-greater depth and precision.