
In an era where data drives nearly every aspect of business decision-making, visual representation of analytics is crucial for informed decision-making and strategic planning. Microsoft’s introduction of the trends visualization feature in Clarity marks a significant turning point in the field of data analytics. Launched on July 16, this new capability enhances the Clarity platform by providing marketers, product teams, and UX designers with a more dynamic approach to interpreting analytics data. By allowing users to view line graphs directly on dashboard cards, Clarity not only shifts from static data presentations but also provides a temporal dimension to data analysis, effectively transforming the way users interact with and understand their data. This evolution signals Microsoft’s commitment to advancing its analytics solutions to meet users’ growing needs for precision, clarity, and accessibility.
User-Centric Innovation
The development of the trends feature in Microsoft Clarity epitomizes the company’s commitment to responding to user demand and incorporating user feedback into its products. This approach underscores the customer-first methodology that Microsoft has adopted in its platform engineering. With this feature, Microsoft addresses a specific request from users who sought more visual representation options for their data. Previously, users had to rely on static data presentations or employ external tools to visualize trends over time. The inclusion of line graphs on the dashboard cards revolutionizes how users perceive and analyze their data. This innovation is part of Clarity’s broader strategy of continuous platform enhancements, including earlier updates like Google Ads integration and Campaign Insights functionality. By paying close attention to the desires and challenges faced by users, Microsoft ensures that Clarity remains a relevant and vital tool for digital businesses.
Functionality and Accessibility
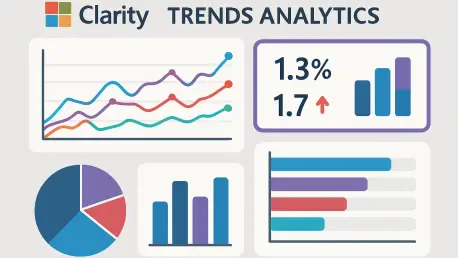
At the heart of the new trends feature is its ability to provide users with a clear yet comprehensive view of temporal changes in their data. Through the use of line graphs representing shifts over the past 30 days, users can easily track and analyze data trends, uncover new insights, and make data-driven decisions without needing separate reporting tools. These line graphs offer a dual representation of data, showing both volume and proportion. Metrics such as session counts are effectively portrayed alongside percentage breakdowns, offering users a deeper understanding of their data’s nuances. This contextual visualization is particularly beneficial for businesses seeking to interpret complex analytics and convert this information into actionable strategies. The seamless integration of this feature into the existing Clarity dashboard, requiring no additional setup from users, exemplifies Microsoft’s commitment to accessibility. By maintaining simplicity and usability, the trends feature democratizes data analytics, allowing stakeholders of all technical proficiencies to benefit.
Enhancing Analytical Depth
The introduction of a 30-day timeframe for data visualization strikes a crucial balance between analytical depth and practical utility. By focusing on a manageable period, users gain significant insights into meaningful patterns while avoiding the noise that can accompany long-term historical data. This timeframe selection ensures that users can identify trends and make timely interventions in their operational or marketing strategies. Moreover, the ease of accessing trend lines for various metrics, such as country-based traffic and browser usage, elevates the analytical capacity businesses can leverage. Such data-driven insights offer a significant competitive advantage, allowing organizations to adapt swiftly in response to observed patterns or emerging trends. Microsoft Clarity’s decision to offer temporal pattern tracking supports businesses’ needs for monitoring progress and refining strategies efficiently, thus providing a more comprehensive analytical picture than traditional static models.
Integration with Other Features
The trends visualization feature is intelligently designed to complement Clarity’s existing suite of functionalities, such as session recordings and heatmaps. This synergy between features allows users to construct a more holistic understanding of user behavior and website performance. By integrating temporal analysis with static heatmaps or session recordings, businesses can gain richer insights into how and why users engage with their platforms the way they do. Furthermore, Microsoft has engineered this feature to work alongside the AI-driven Campaign Insights, enhancing the platform’s capabilities to deliver optimization recommendations based on real-time data. This integration ensures that Clarity not only meets current analytical needs but also supports forward-thinking strategies by enabling users to visualize temporal patterns and make data-backed predictions. Ultimately, the trends feature helps organizations harness the full potential of their analytics by combining temporal and static data analyses, providing actionable insights that inform strategic decisions.
User Benefits and Applications
The introduction of trends visualization in Microsoft Clarity opens up myriad possibilities for diverse business functions. Marketing teams, for instance, can utilize this feature to monitor the impacts of their campaigns more effectively, identify peaks or troughs in engagement, and make prompt adjustments to optimize results. For product development and UX teams, the ability to observe changes in user behavior over time provides invaluable insights into usability concerns or acceptance of recent updates. The visual representation of performance data facilitates easier comprehension among stakeholders, bridging gaps in technical understanding and promoting collaborative decision-making. By delivering data insights through an intuitive and accessible interface, the trends feature has transformed how businesses can approach analytics, allowing them to align their operations more closely with their strategic goals and consumer expectations.
Data Privacy and Performance
Microsoft has maintained its strong commitment to data privacy and performance standards with the introduction of the trends feature in Clarity. All existing privacy protocols remain consistent, ensuring users need not worry about additional data retention requirements. Furthermore, the implementation of this feature has been carefully designed to have minimal impact on performance, ensuring that users do not experience significant changes in page loading times or overall user experience. This thoughtful approach ensures that while substantive new features are added, they do not compromise the platform’s efficiency or security. Clarity’s ability to uphold these standards further cements its reputation as a reliable analytics platform for businesses looking to leverage data insights while maintaining stringent privacy norms.
Future Developments and Compatibility
Looking ahead, the trends feature shows promise for further expansion as Microsoft continues to evolve the Clarity platform. While the current focus is on the 30-day analysis, there is potential for extending this feature to encompass longer timeframes. Doing so would allow businesses to explore more extensive patterns and possibly derive correlations from longer periods. Compatibility has been a key consideration in the feature’s development, ensuring that the trends visualization is accessible across major browsers and operating systems, thus providing universal access for users worldwide. This foresight paves the way for the trends feature to remain a pivotal element of Microsoft’s analytics strategies, adaptable to future user needs and technological advancements. As data analytics becomes an increasingly integral part of business decision-making, Clarity’s evolving capabilities promise to keep organizations at the forefront of data-driven insights, facilitating better outcomes and growth opportunities.
A Roadmap for the Future
Microsoft Clarity’s introduction of trends visualization with line graphs marks a transformative addition to the analytics platform landscape. This feature has provided businesses with a visually dynamic, user-friendly approach that supports temporal analysis, enabling more profound insights into user behavior, campaign impacts, and technological preferences. By integrating user feedback and building upon previous platform functionalities, Microsoft underscored its commitment to offering a robust tool adaptable for future developments. As businesses continue to navigate the data-driven world, Clarity’s evolving capabilities will be crucial in aiding organizations to remain at the forefront of innovation and strategic decision-making. The insights drawn from the trends feature will help companies refine strategies, optimize user experiences, and propel growth, ensuring they remain competitive in ever-evolving markets.